3.2 Inserting graphs
Graphs or charts can be placed into word processing documents to display data in a more visual way.
Word processing exercise 2
Inserting graphs
Skills practised
- Formatting text
- Inserting charts
- Wrapping text
In this exercise you will create the business flyer shown below.
- Open the data file downloaded from the above link. It contains the text for the document.
- Create a company logo using WordArt or styles at the top of the document.
- Place the cursor after the second paragraph.
- If you are using Microsoft Word:
- Use the
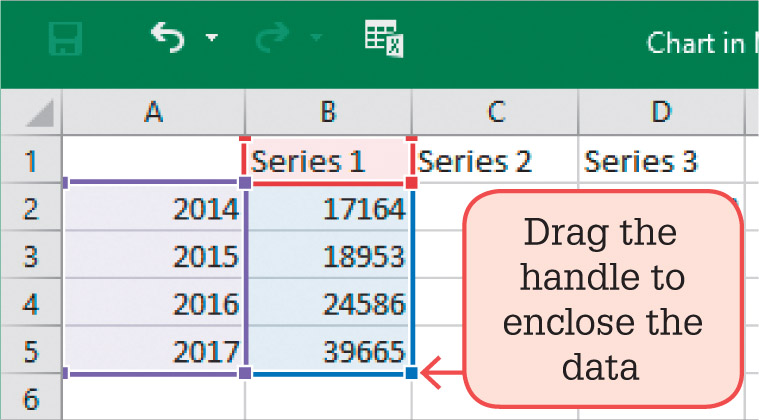
CHARTicon from theINSERTtab of the ribbon to start the chart and select theCOLUMNchart option. A Microsoft Excel DATA pane will open. - Enter the values shown in the diagram and drag the bottom right handle to enclose the entries.
- Close the
DATApane, set theLAYOUT OPTIONSicon to set theTEXT WRAPPINGtoTOP AND BOTTOMso that the text is placed above and below the chart. - Format the chart. You can use the
CHART STYLESin the ribbon or format each section of the chart by selecting its individual sections in turn.
- Use the
- If you are using Google Docs, the chart needs to be created in Google sheets.
- Open Google Sheets, start a new document, enter the data and highlight it.
- Select
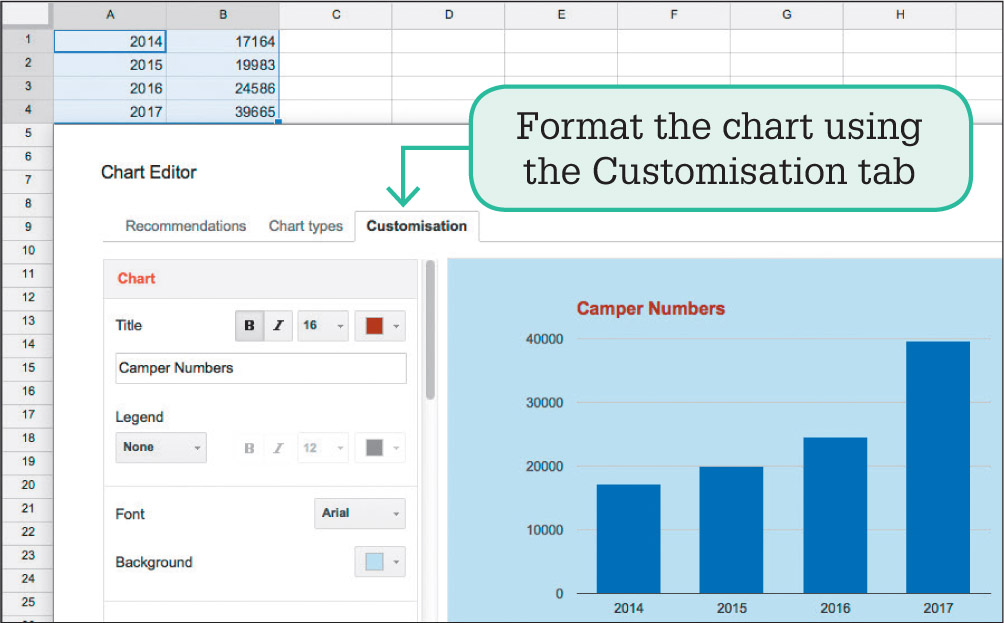
CHARTfrom the Insert menu, select a chart from theRECOMMENDATIONStab then open theCUSTOMISATIONtab. - Enter a
CHART TITLE, add aBACKGROUND, turn off theLEGENDand, in theAXIS HORIZONTALsection, turn onTREAT LABELS AS TEXTso that the years are displayed correctly. - Select
INSERTto complete the chart then save it as an image using the down arrow at the top right of the chart. - Open your Google Docs file and insert the image from your Downloads folder.
- Once the flyer is complete, save it, spell check it and proofread it. Once corrections have been made, print a final copy or share your work electronically.