17.3 Australia’s changing trade patterns
Direction of trade
Australia has always been a high trading nation. Traditionally we have been exporters of commodities such as agricultural and mining products, and importers of manufactured products such as electrical appliances, clothing, footwear, cars and computer products. The direction of our trade has shifted considerably in recent decades.
In 1900 the United Kingdom (UK) was Australia’s primary trading partner. Total trade with the UK was more than five times greater than the trade with Australia’s second largest trading partner, the United States of America (USA). Other significant trading partners to Australia were European countries and members of the British Empire. The trade between Australia and the UK reflected Australia’s historical connection to the UK in its growing trading relationships. During this trading period, Australia relied on the UK for more than half of its export income.
During the 1950s more than one-third of our export income came from sales to the UK. Since the 1960s, however, the direction of our trade has shifted.
Since the late 1960s when Great Britain made a decision to join the European Economic Union (EEC) Australia’s level of trade with Europe has declined significantly. Sixty per cent of Australia’s exports now go to the Asia Pacific region. Japan and USA are now our major sources of imported consumer goods.
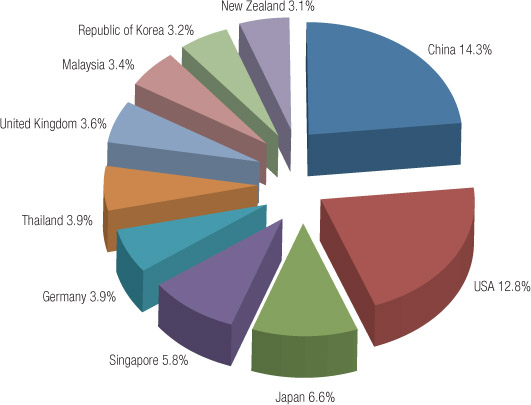
By 1999—2000, the balance of Australia’s trading relationships had changed significantly. Our trade focus is now firmly on the members of the Asia–Pacific Economic Cooperation (APEC) trade group. Nine of Australia’s 10 major trading partners are members of it.
In 2012—13 over 70% of Australia’s trade took place with countries that are part of APEC. (see Source 17.10).

-
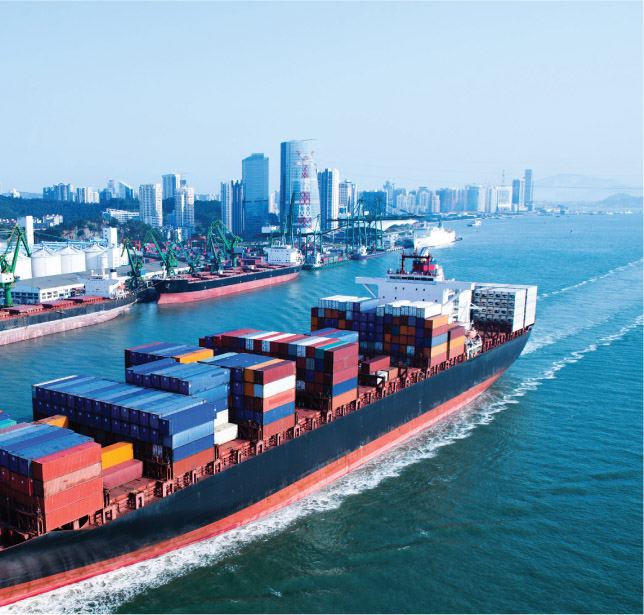
Source 17.11 China is currently our most important trading partner. -

Source 17.12 Minerals are our most important exports.
DEVELOPING YOUR UNDERSTANDING 17.5
- Describe how Australia’s direction of trade has changed since 1959. You can quote the statistics set out in sources 17.13, 17.14 and 17.15 to support your argument.
- Explain why this pattern of trade changed.

RESEARCH 17.3
Composition of trade
Primary products in the form of agricultural products and mining products have always been the primary focus of our exports. We have always had a comparative advantage in the production of these products. Commodities are still, however, our main source of export income (61% in 2012). Mining products, such as gold and iron ore make up approximately half of our export income and farm produce 10%.

| Australia’s main exports 2012–13 (A$m) | Australia’s main imports 2012–13 (A$m) | ||
|---|---|---|---|
| 1 Iron ores and concentrates | $57 201 | 1 Crude petroleum | $20 186 |
| 2 Coal | $38 637 | 2 Passenger motor vehicles | $17 330 |
| 3 Gold | $15 287 | 3 Refined petroleum | $16 868 |
| 4 Natural gas | $14 314 | 4 Telecom equipment and parts | $8916 |
| 5 Crude petroleum | $9718 | 5 Medicaments | $8050 |
Exports
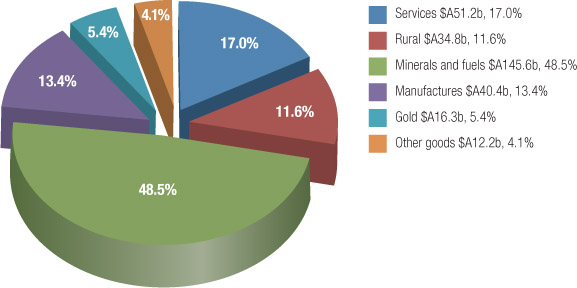
In 2013, mineral and fuels, especially iron ore and coal, made up half of Australia’s export income. In contrast, the importance of manufacturing and agriculture has fallen significantly in recent decades.
Imports
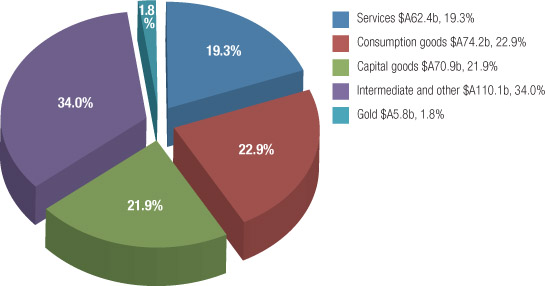
Australia relies heavily on imports of services, and finished manufactured goods for consumption. A large proportion of imports is also made up of intermediate products such as car components.
The main items traded with our Asian trading partners
Australia imports many goods from other countries. As described above, these items include motor vehicles, televisions and other electrical goods. Some of our main trading partners include:
- China
- Japan
- USA
- Republic of Korea.
Being able to establish and develop markets and trading agreements between Australia and Asian countries allows Australian businesses to continue to grow and develop, and in turn provide jobs for people in Australia. In April 2014 the Abbott government signed a number of trade agreements with our trade partners. The agreements covered free trade and reducing or removing tariffs (taxes on imports) with the Republic of Korea, China and Japan. The agreements will allow Australian companies to move into these countries and be more competitive, and in return Australian consumers should be able to access cheaper imported goods.
The agreement with Japan covers areas such as sugar, ice cream, yoghurt, beef and cheese. The tariffs on Australian products will be reduced, meaning that Australian companies will be more competitive. The quotas and amounts Australian companies can export will also increase, allowing companies such as those who supply cheese to be able to sell more than previously. Service industries such as the financial and legal sectors, the telecommunications industry and the education sectors will also benefit from the agreement.
This move means that Australian will continue to increase and develop trading relationships with Asian countries.
DEVELOPING YOUR UNDERSTANDING 17.6
Read the extract and answer the questions that follow.
Australian importers and exporters have had a tough couple of years thanks to quiet global growth, unpredictable currencies and a mining-dominated Australian economy. However, there are better times ahead for internationally active Australian small and medium businesses.
After a two and a half year slump, Australia’s Trade Confidence Index shows a sharp uplift in Australian businesses’ trade confidence, with nearly half Australian respondents expecting trade volumes to rise over the next six months – up from 40 per cent six months ago.
At a sector level, construction and wholesale/retail importers appear to be the most optimistic (positive) about their six-month trade outlook.
Amongst construction and building companies, the historically low Reserve Bank of Australia interest rates and increasing house prices have driven a 30% pick-up in building approvals in the past year which is leading to a rise in the importation of building materials as construction begins.
Similarly, the 6% rise in retail sales over the past year reflects a growth in demand for consumer goods.
From an exporting viewpoint, the low Australian dollar, improving UK and US economies and China’s focus towards more consumer-led economic growth, is starting to have a positive impact on Australian businesses with interests abroad.
Australian Fashion Labels is an example of a business that is benefiting from the improved trading conditions.
An Adelaide-based company, which designs affordable and high quality ladies fashion, began selling within Australia in 2007 before expanding into US, UK, Japan, Germany and Hong Kong. By 2012, 50% of its sales were outside of Australia. Over the remainder of 2014 and next year, Australian Fashion Labels will begin establishing its own stores in the US and UK to take advantage of the returning consumer confidence in both markets.
The Trade Confidence Index reveals Australian businesses’ strong links with Asia. The report finds 90% of Australian companies surveyed currently trade with Asia and nearly 75% see it as the most promising region for trade over the next six months, compared to the global average of 42%.

People in Asia have more than tripled their financial wealth since 2001 to just over US$80 trillion and this is likely to continue. Tapping into the growing consumer market in areas like education, tourism, financial services, infrastructure and agriculture will be important for Australian companies continued growth.
Source 17.20 An extract based on the article ‘SMEs’ international trade outlook on the rise’
- Explain why Australia’s Trade Confidence Index is starting to increase.
- Identify which sectors of the economy seem to be the most optimistic about the future.
- Explain why these sectors are positive.
- Outline what Australian Fashion Labels has done since it was started.
- Suggest why it is important for Australian organisations to develop trading links with Asia.
In 2012, Australia’s trade in goods and services reached a record high. Two-way trade increased by 1.5% to $623.8 billion, up from $614.5 billion in 2011. China, Japan, USA and the Republic of Korea were Australia’s top four trading partners again in 2012.
-
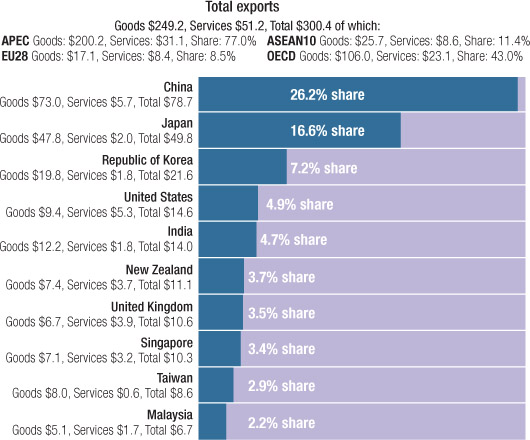
Source 17.21 Australia’s top 10 export markets 2012 ($ billion) -
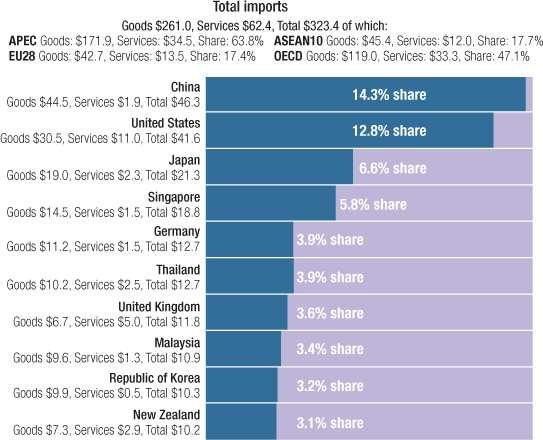
Source 17.22 Australia’s top 10 import sources 2012 ($ billion)
-
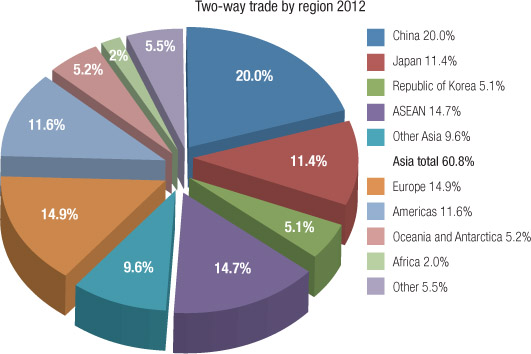
Source 17.23 Total two-way trade by region 2012 -
When examining the tables above (Sources 17.21 and 17.22) a number of facts and trends can be found. China, Japan and the Republic of Korea are Australia’s main export markets. In the case of imports, it is China, USA and Japan. When looking at two-way trade (Source 17.23), the top three are China, Japan and the Republic of Korea (60.8% of total trade is with Asian countries).
DEVELOPING YOUR UNDERSTANDING 17.7
Examine the information in Sources 17.21 and 17.22 and answer the following questions.
- Suggest why the top three export markets are in Asia.
- The import sources are different from the export sources. Identify which countries are in the top 10 exports but not imports.
- Visit the DFAT website (www.cambridge.edu.au/hass9weblinks) and examine the two-way trade and import and export figures. Are the countries the same, different or similar? Why do you think this is the case?
- Identify three factors that might influence Australia’s trade with Asian countries.


